

WPMVC Debug
In active development
WPMVC Debug is being built right now and hasn't had a stable release yet. The API, the panel and the package name may still change. This page describes where it's headed and what already works.
WPMVC Debug is a debug toolbar and profiler for the WPMVC framework. It adds a floating button to the front end that opens a panel with everything you need to inspect a request while developing: the initialized applications, their components, database queries, logs, the hooks fired during the request, scheduled cron jobs and the server environment.
It is a development tool — install it as a dev dependency and enable it only in local/debug environments. The panel reads state and never alters your application (the only writes are the explicit, admin-only log and cron actions).
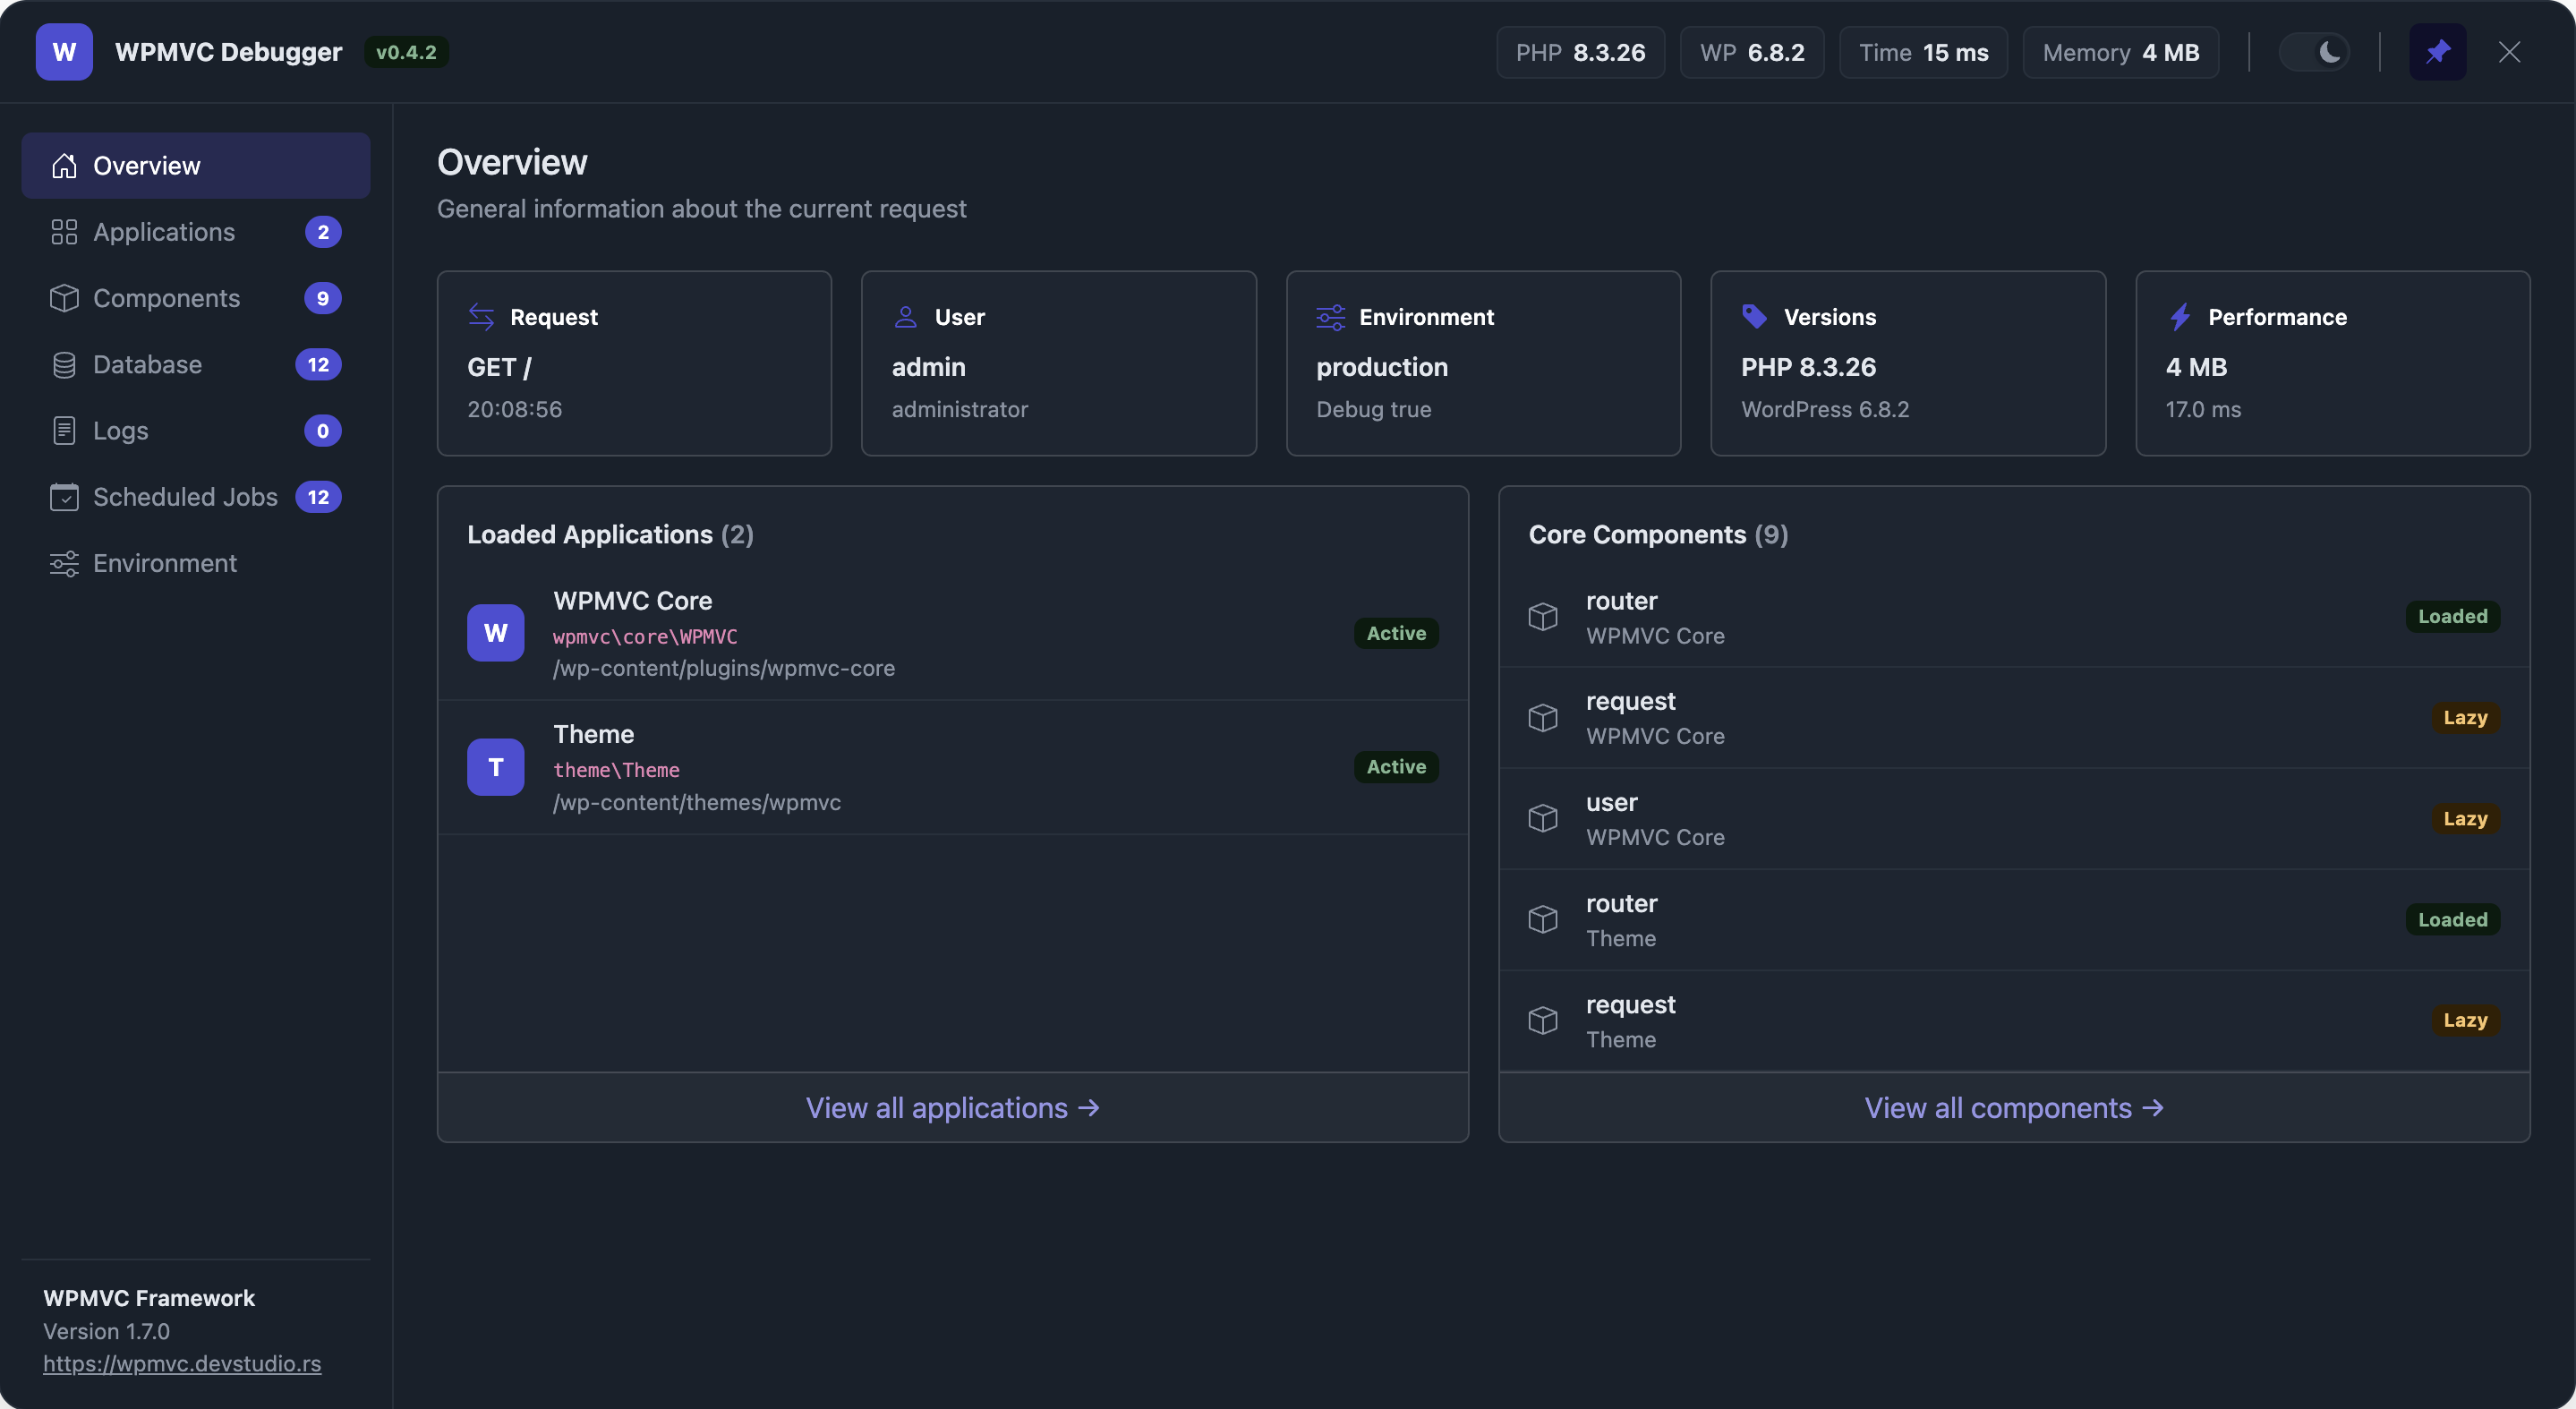
Design
WPMVC Debug is deliberately kept out of the framework core to keep the core light. It ships as a separate Composer package and plugs into an application through the standard component system:
- A separate, dev-only package. Consumed as a dev dependency by an application; it never reaches production.
- Plugs in as a
debugcomponent. Registered under thedebugcomponent key and added tobootstrapso it can attach its hooks early — and only when the environment is a local/debug one (e.g.WP_DEBUG). No special wiring in the core. - The core never knows about the debugger. Where the panel needs to read framework state it uses the framework's public introspection API — it never instantiates a component to read it, so lazy components stay lazy.
- Zero cost when absent. With the package not installed, the framework behaves exactly as before.
The bundled UI is Bootstrap 5.3 compiled with a wpmvc- prefix on every class and CSS variable, so it can't clash with a theme that already loads Bootstrap. It supports light and dark themes (dark by default) and can be pinned so it survives page reloads.
Requirements
- PHP 7.0+
- WordPress with the WPMVC framework installed
- The package must live under
ABSPATH— it derives its own asset URL from its location.
Installation
Install it as a dev dependency of your application:
composer require --dev devstudio-rs/wpmvc-debugRegister it as a debug component in your application config, and add it to bootstrap only in debug environments so it is never active in production:
// config/main.php
return array(
    // ...
    'bootstrap' => WP_DEBUG ? array( 'view', 'debug' ) : array( 'view' ),

    'components' => array(
        // ...
        'debug' => array(
            'class' => \wpmvc\debug\Debug::class,
        ),
    ),
);
That's all. The component enqueues its assets and renders the panel on wp_footer. The panel is shown to everyone while enabled, but the log and cron actions are restricted to users with the manage_options capability.
Capturing early queries
The Database section captures queries through WordPress's SAVEQUERIES. The component defines the constant automatically when it isn't already set, but that only catches queries running after the debugger loads. To capture the queries that run before it — early core queries — define SAVEQUERIES in wp-config.php.
Sections
The panel is organized into tabs, each covering one area of the request.
Overview
General information about the current request at a glance: method and path, the current user, environment and debug flag, PHP/WordPress versions and performance (peak memory and time). Below it, the loaded applications and a preview of the registered components, each linking to its full tab.
Applications
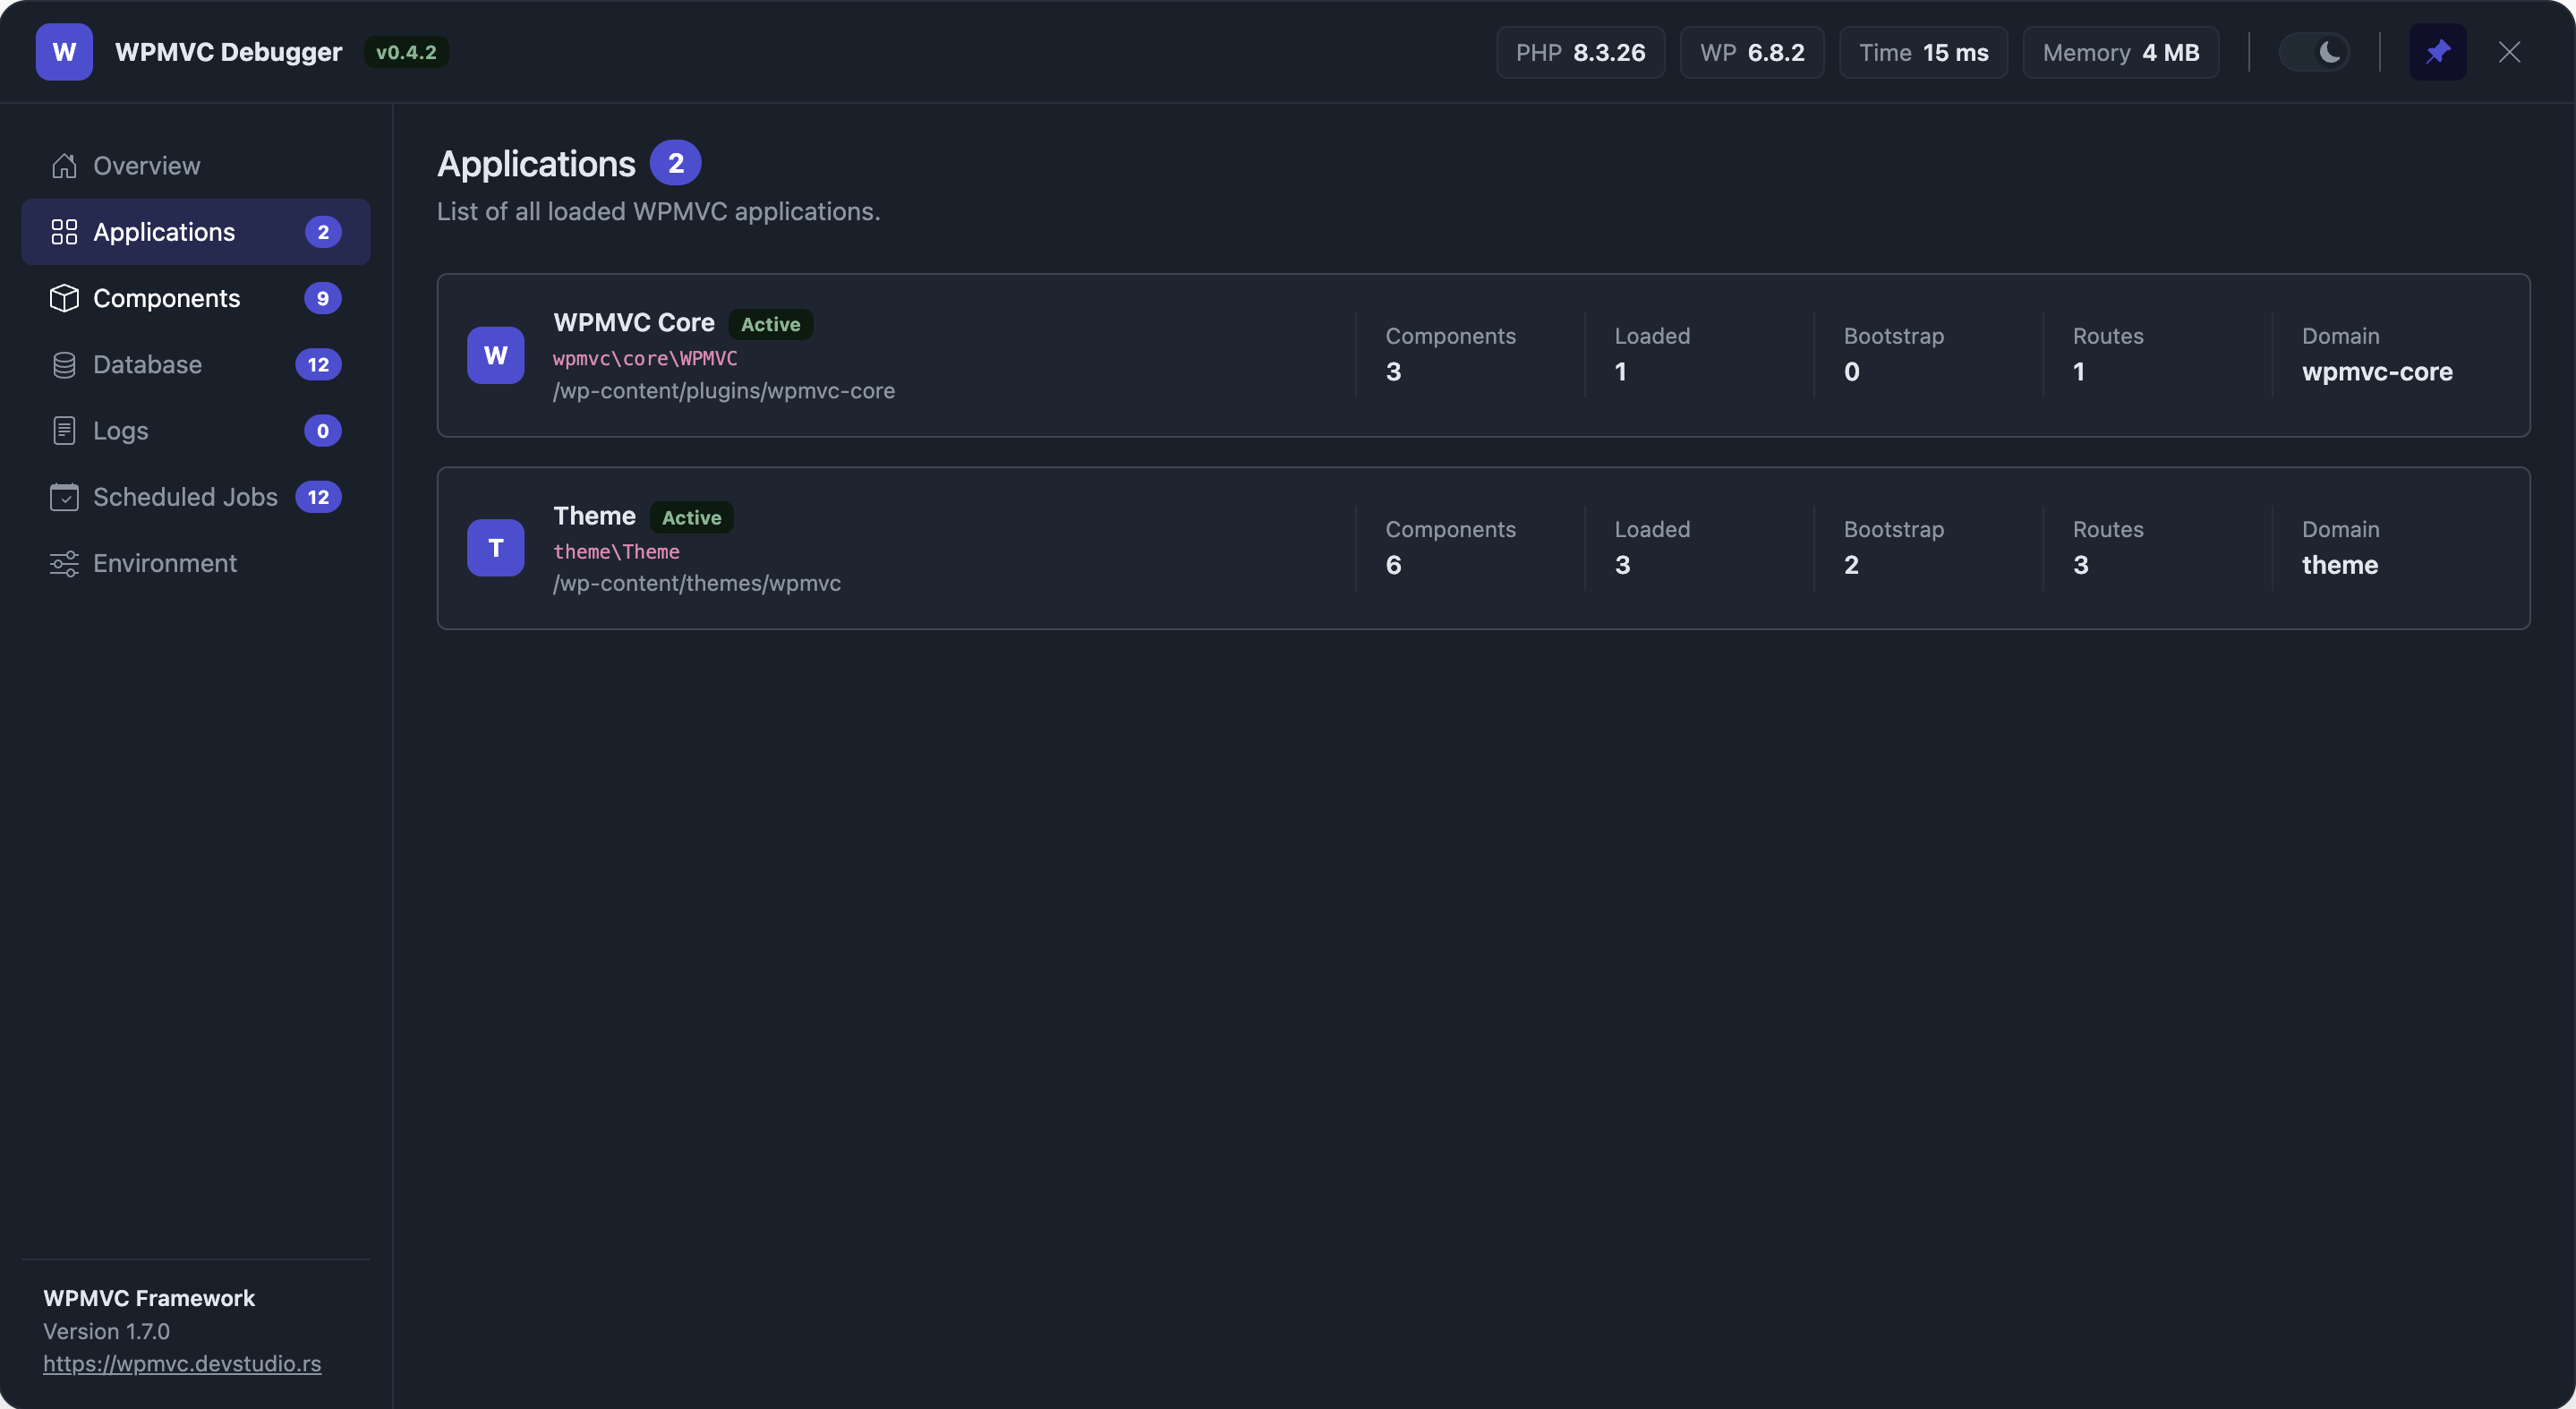
Every initialized WPMVC application instance, with its class, path and domain, and how many components are declared, how many have actually been loaded (lazy loading), how many are eager-loaded via bootstrap, and its registered route count.
Components
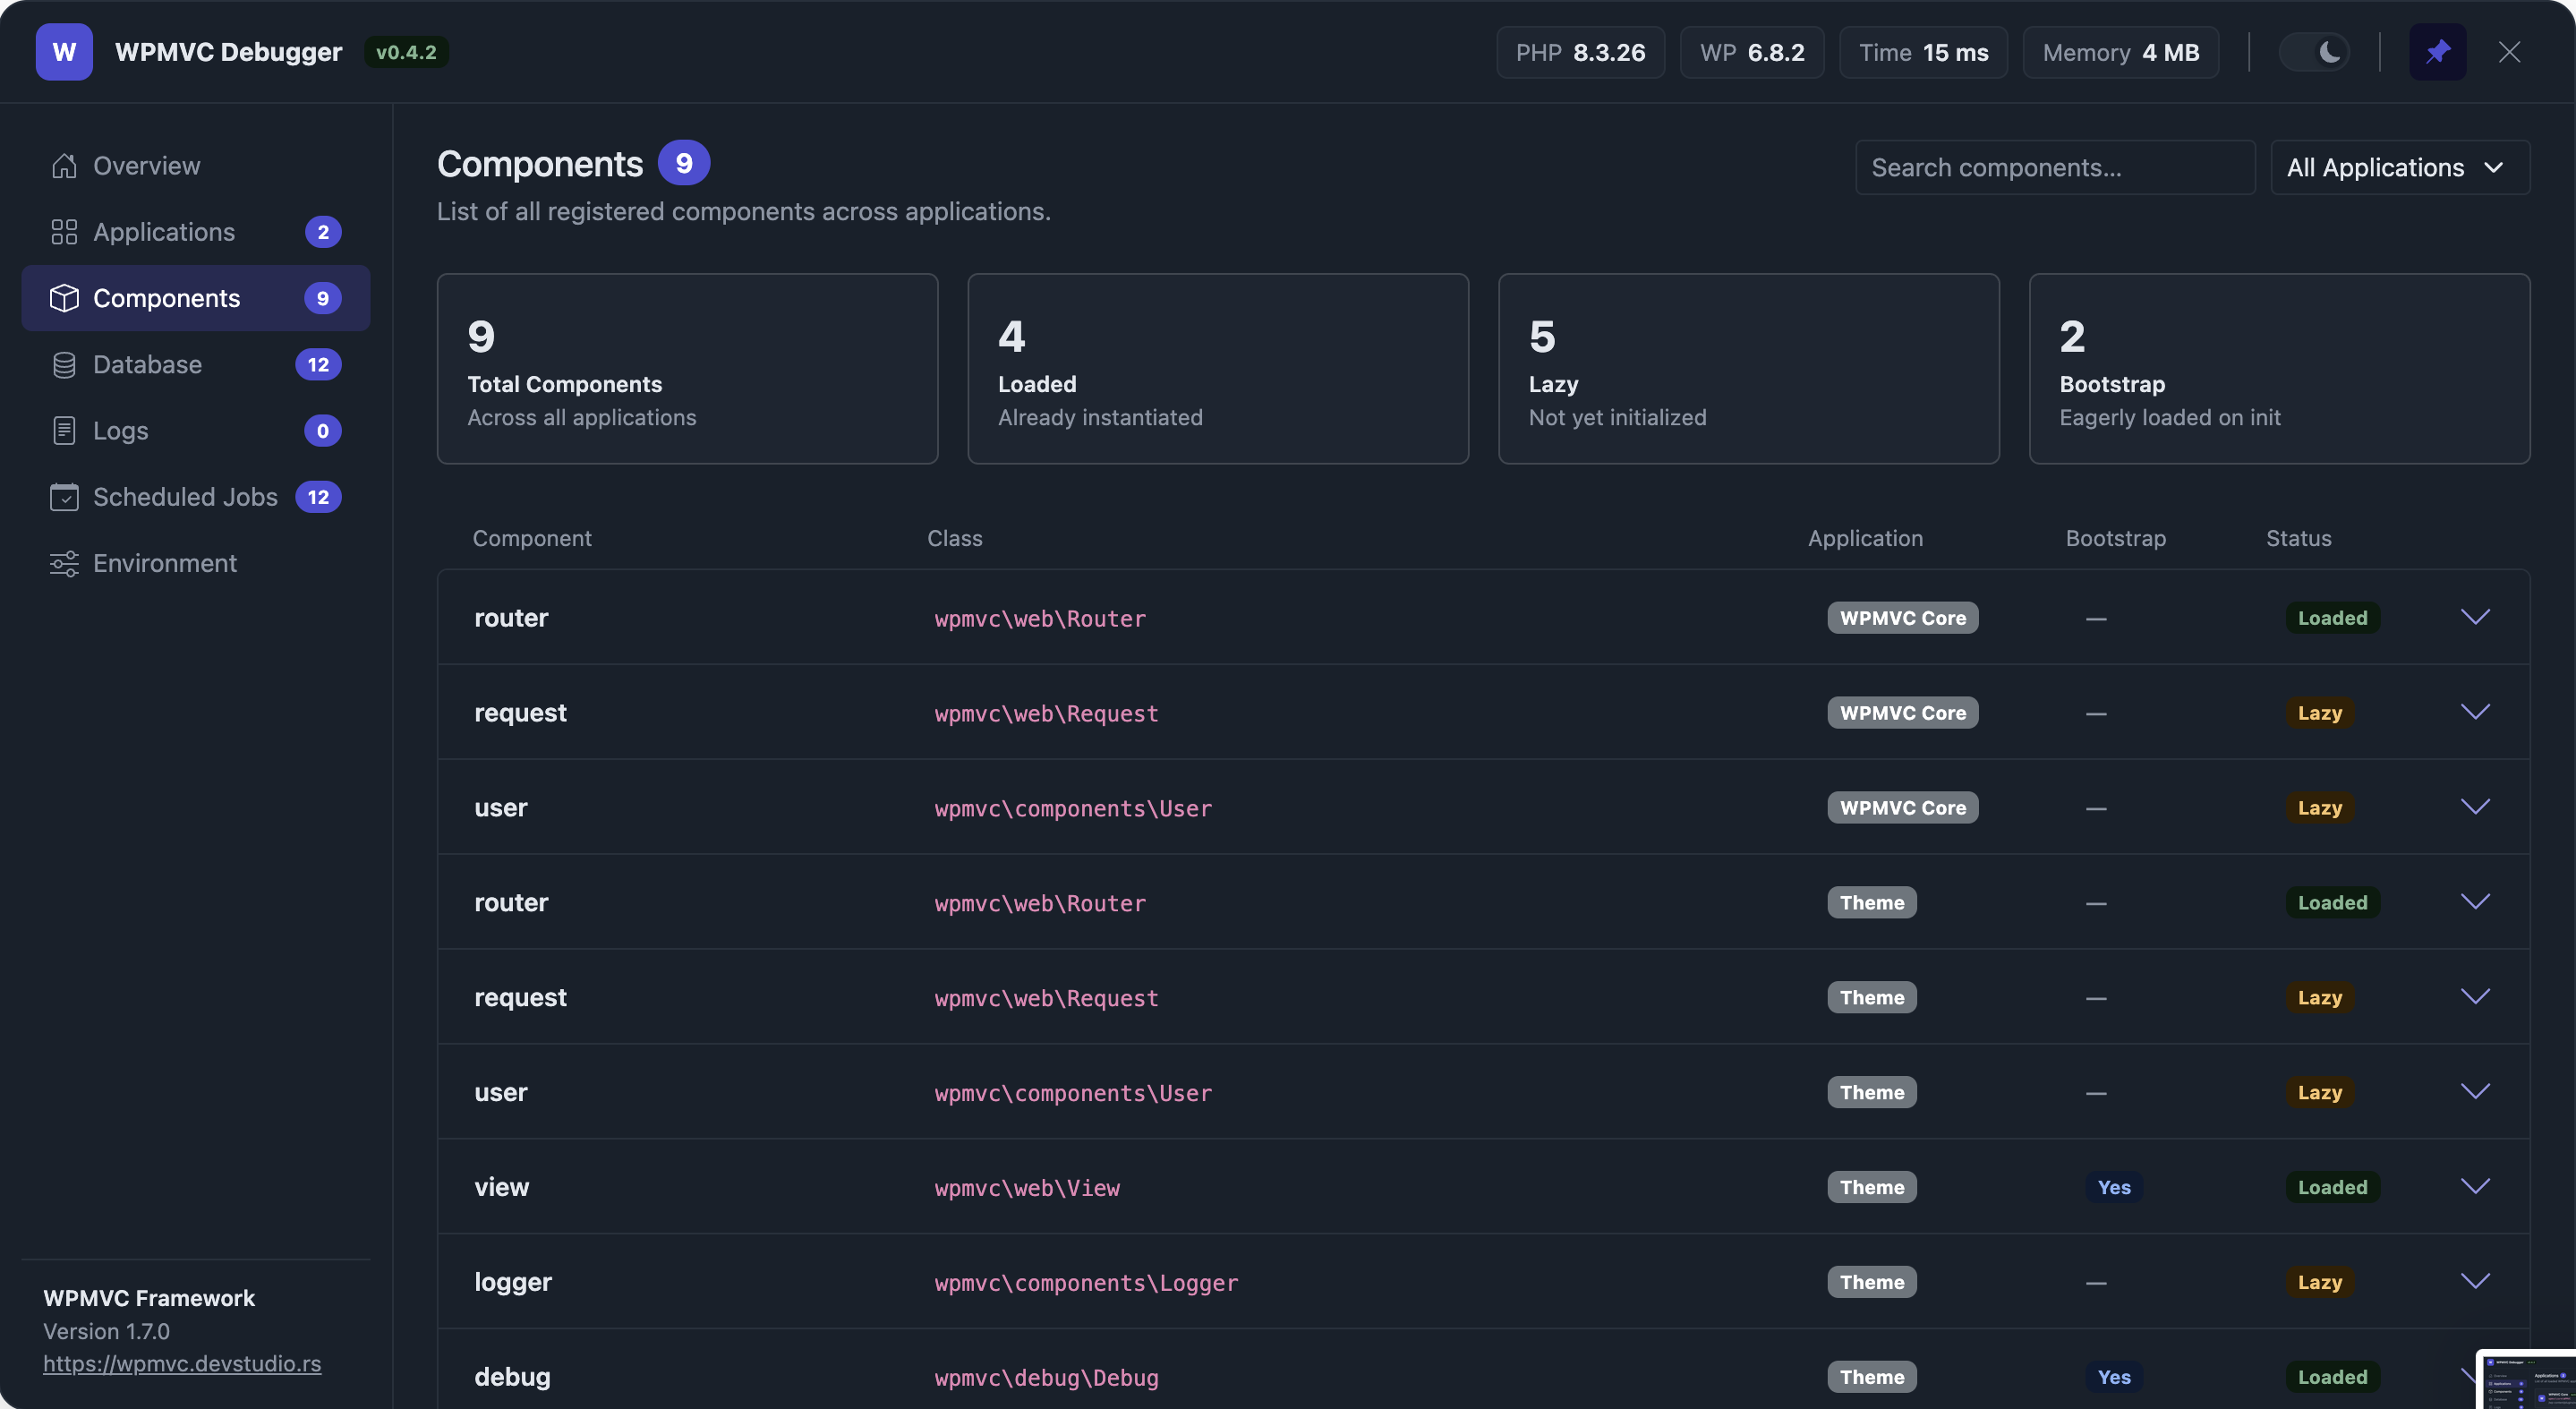
Every component declared across all applications, searchable and filterable by application. Each row expands to show whether it is loaded or still lazy, whether it is a bootstrap component, and the config it was declared with.
Database
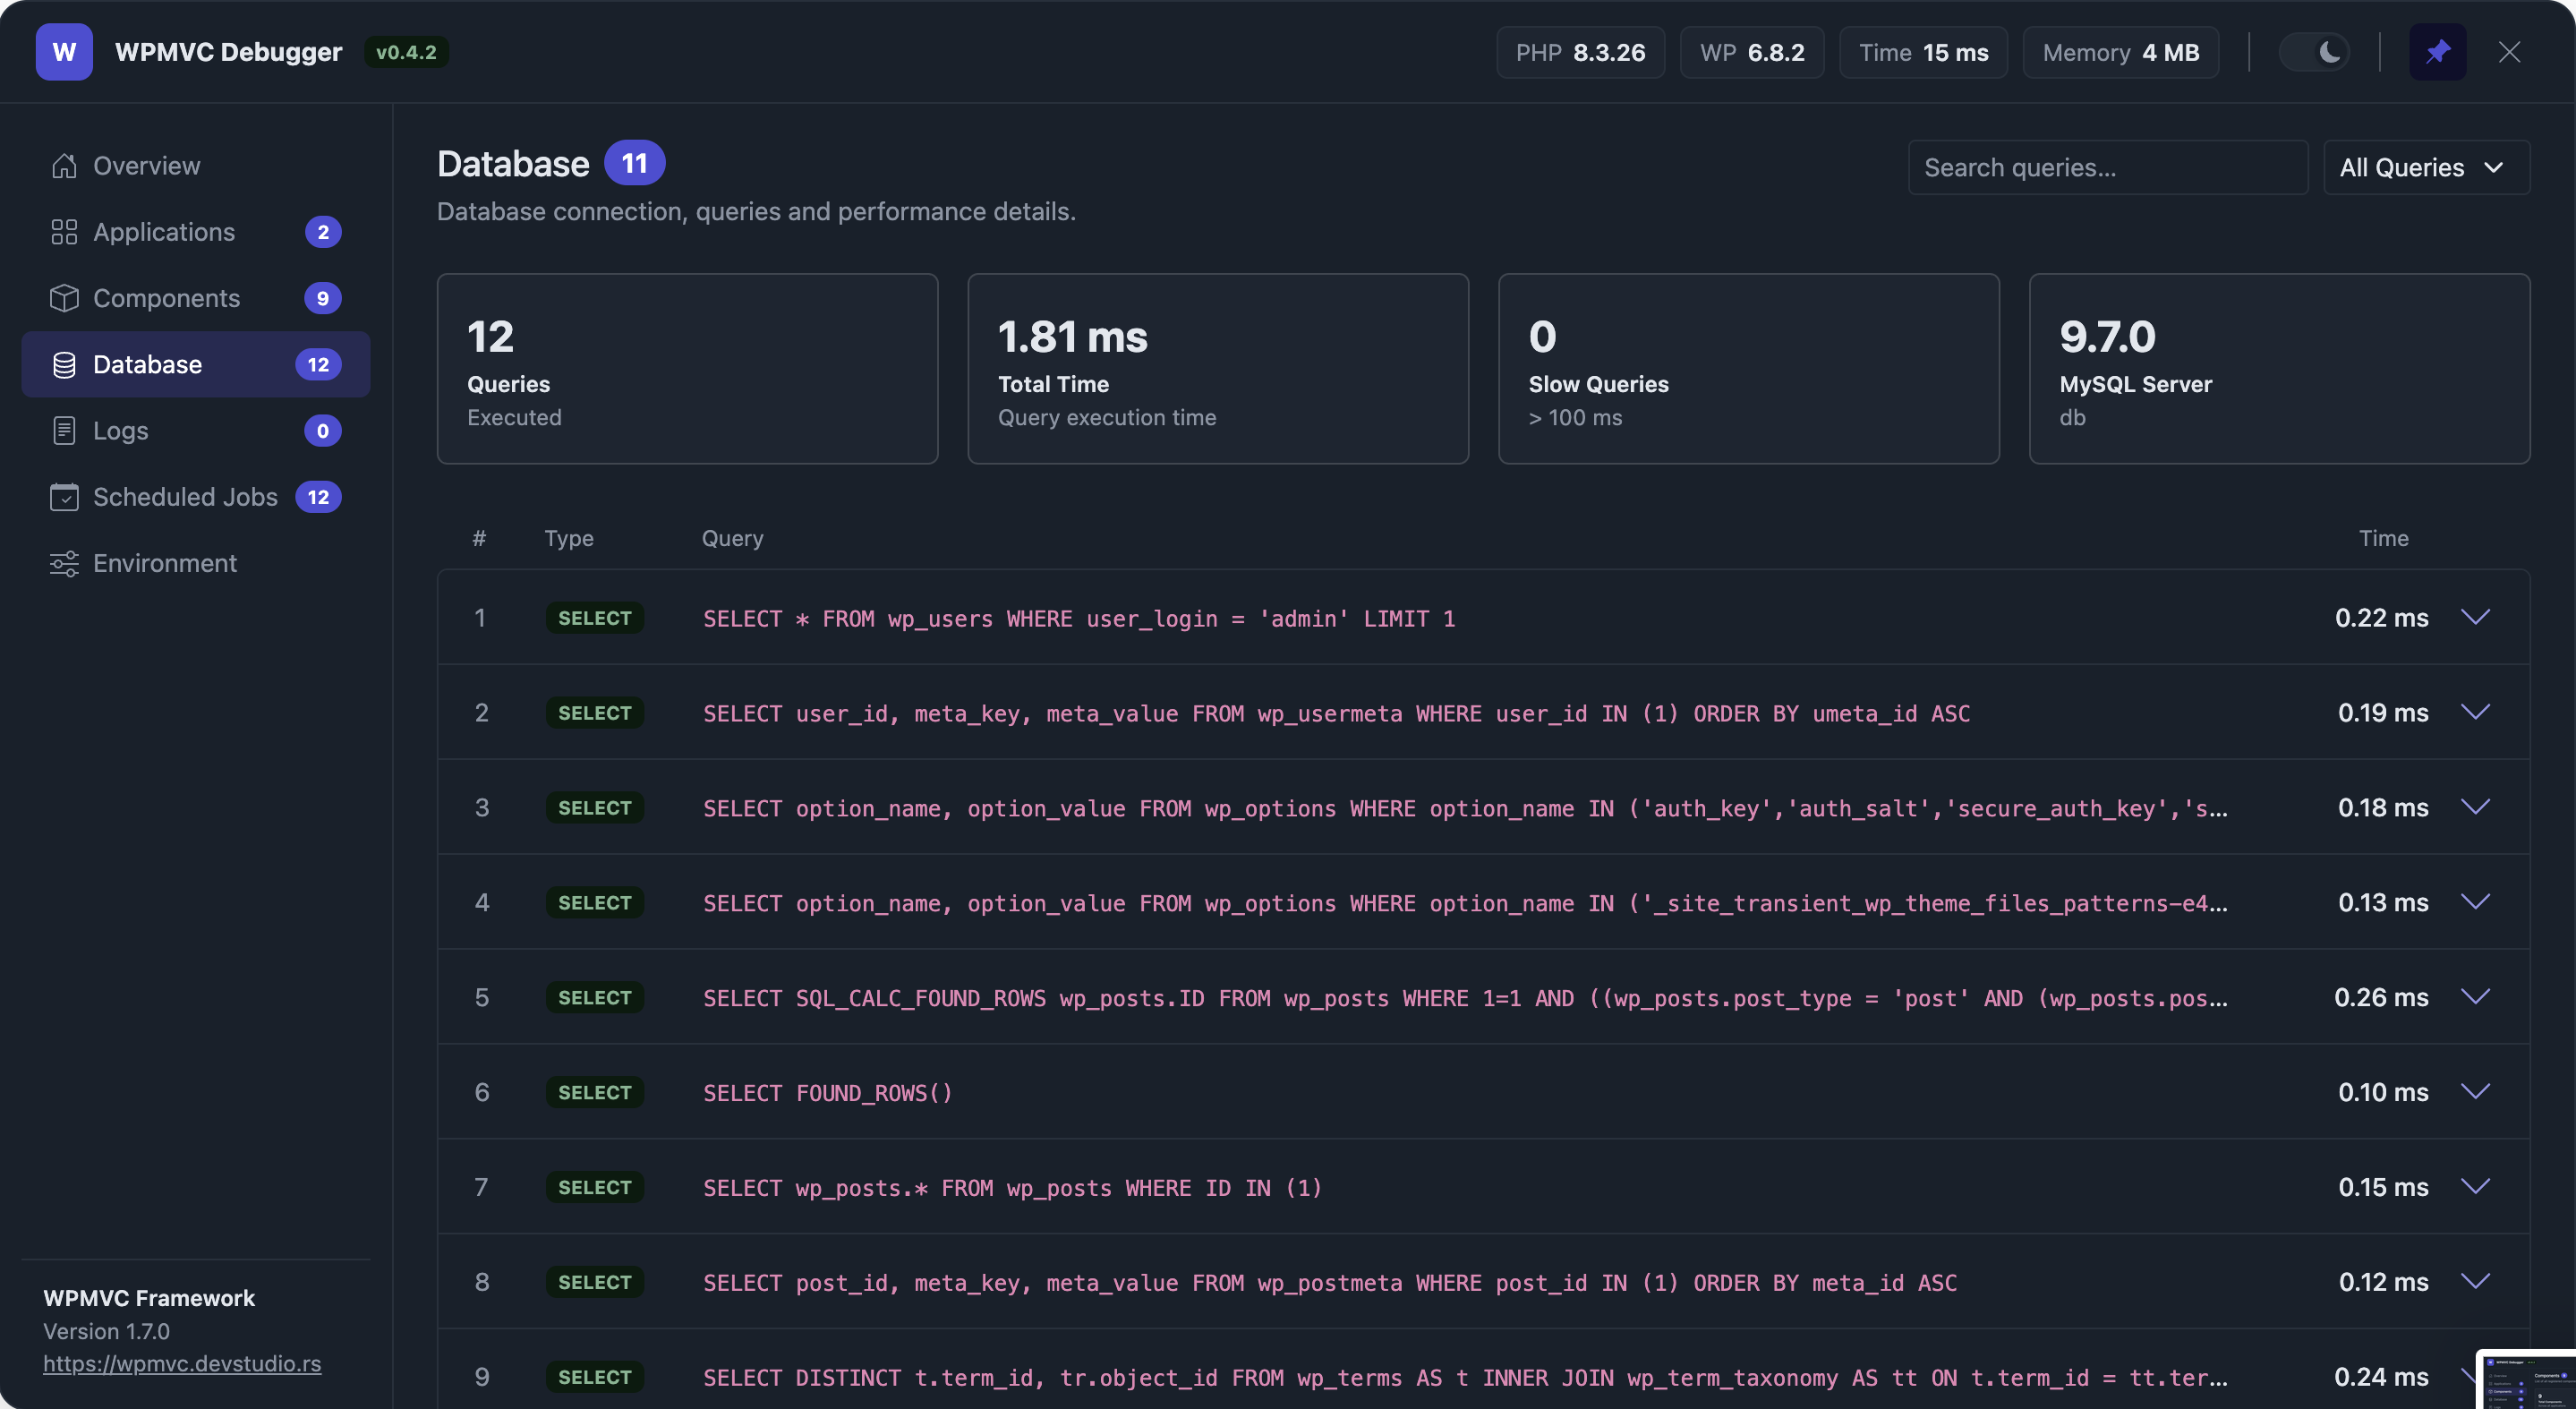
The queries executed during the request (from $wpdb->queries), with a summary of the query count, total time, slow queries and the database server. Each query expands to show the full SQL, its timing and the call stack that triggered it.
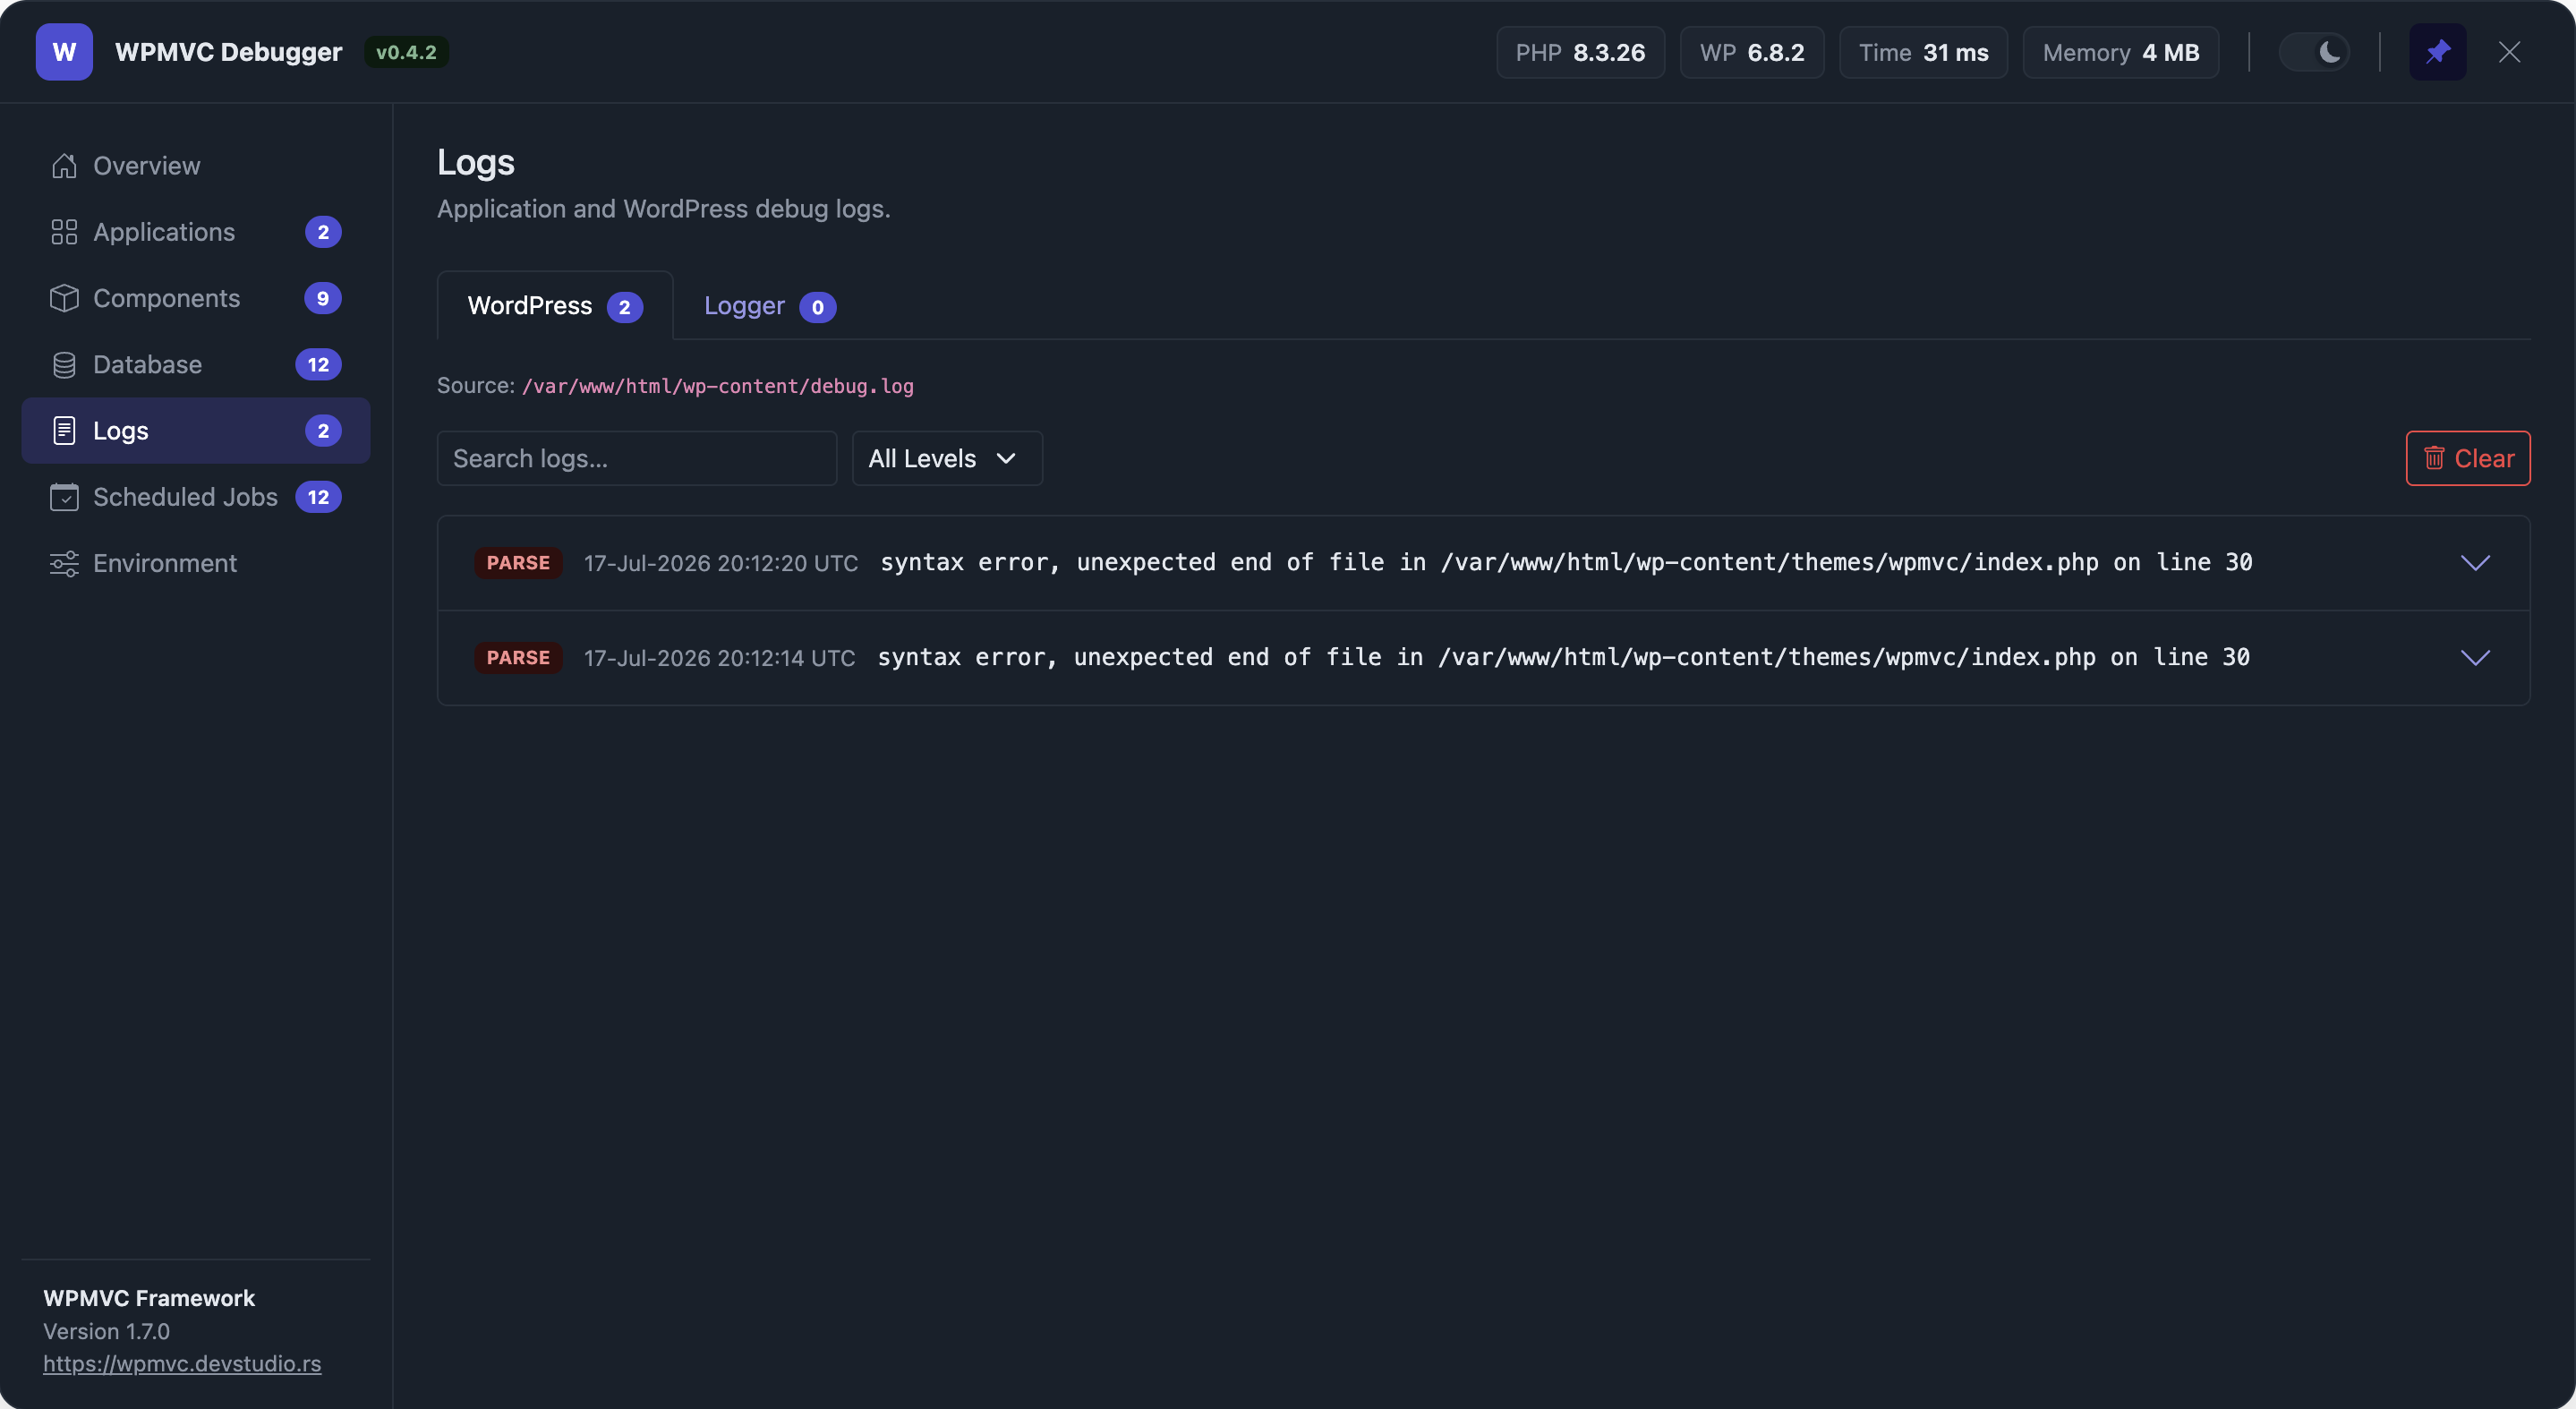
Logs
Two sub-tabs: the WordPress debug log (WP_DEBUG_LOG) and the Logger component's own files. Entries are grouped by level, searchable and filterable, and each expands to its full message (including multi-line stack traces). Administrators get a Clear button per log.
Events
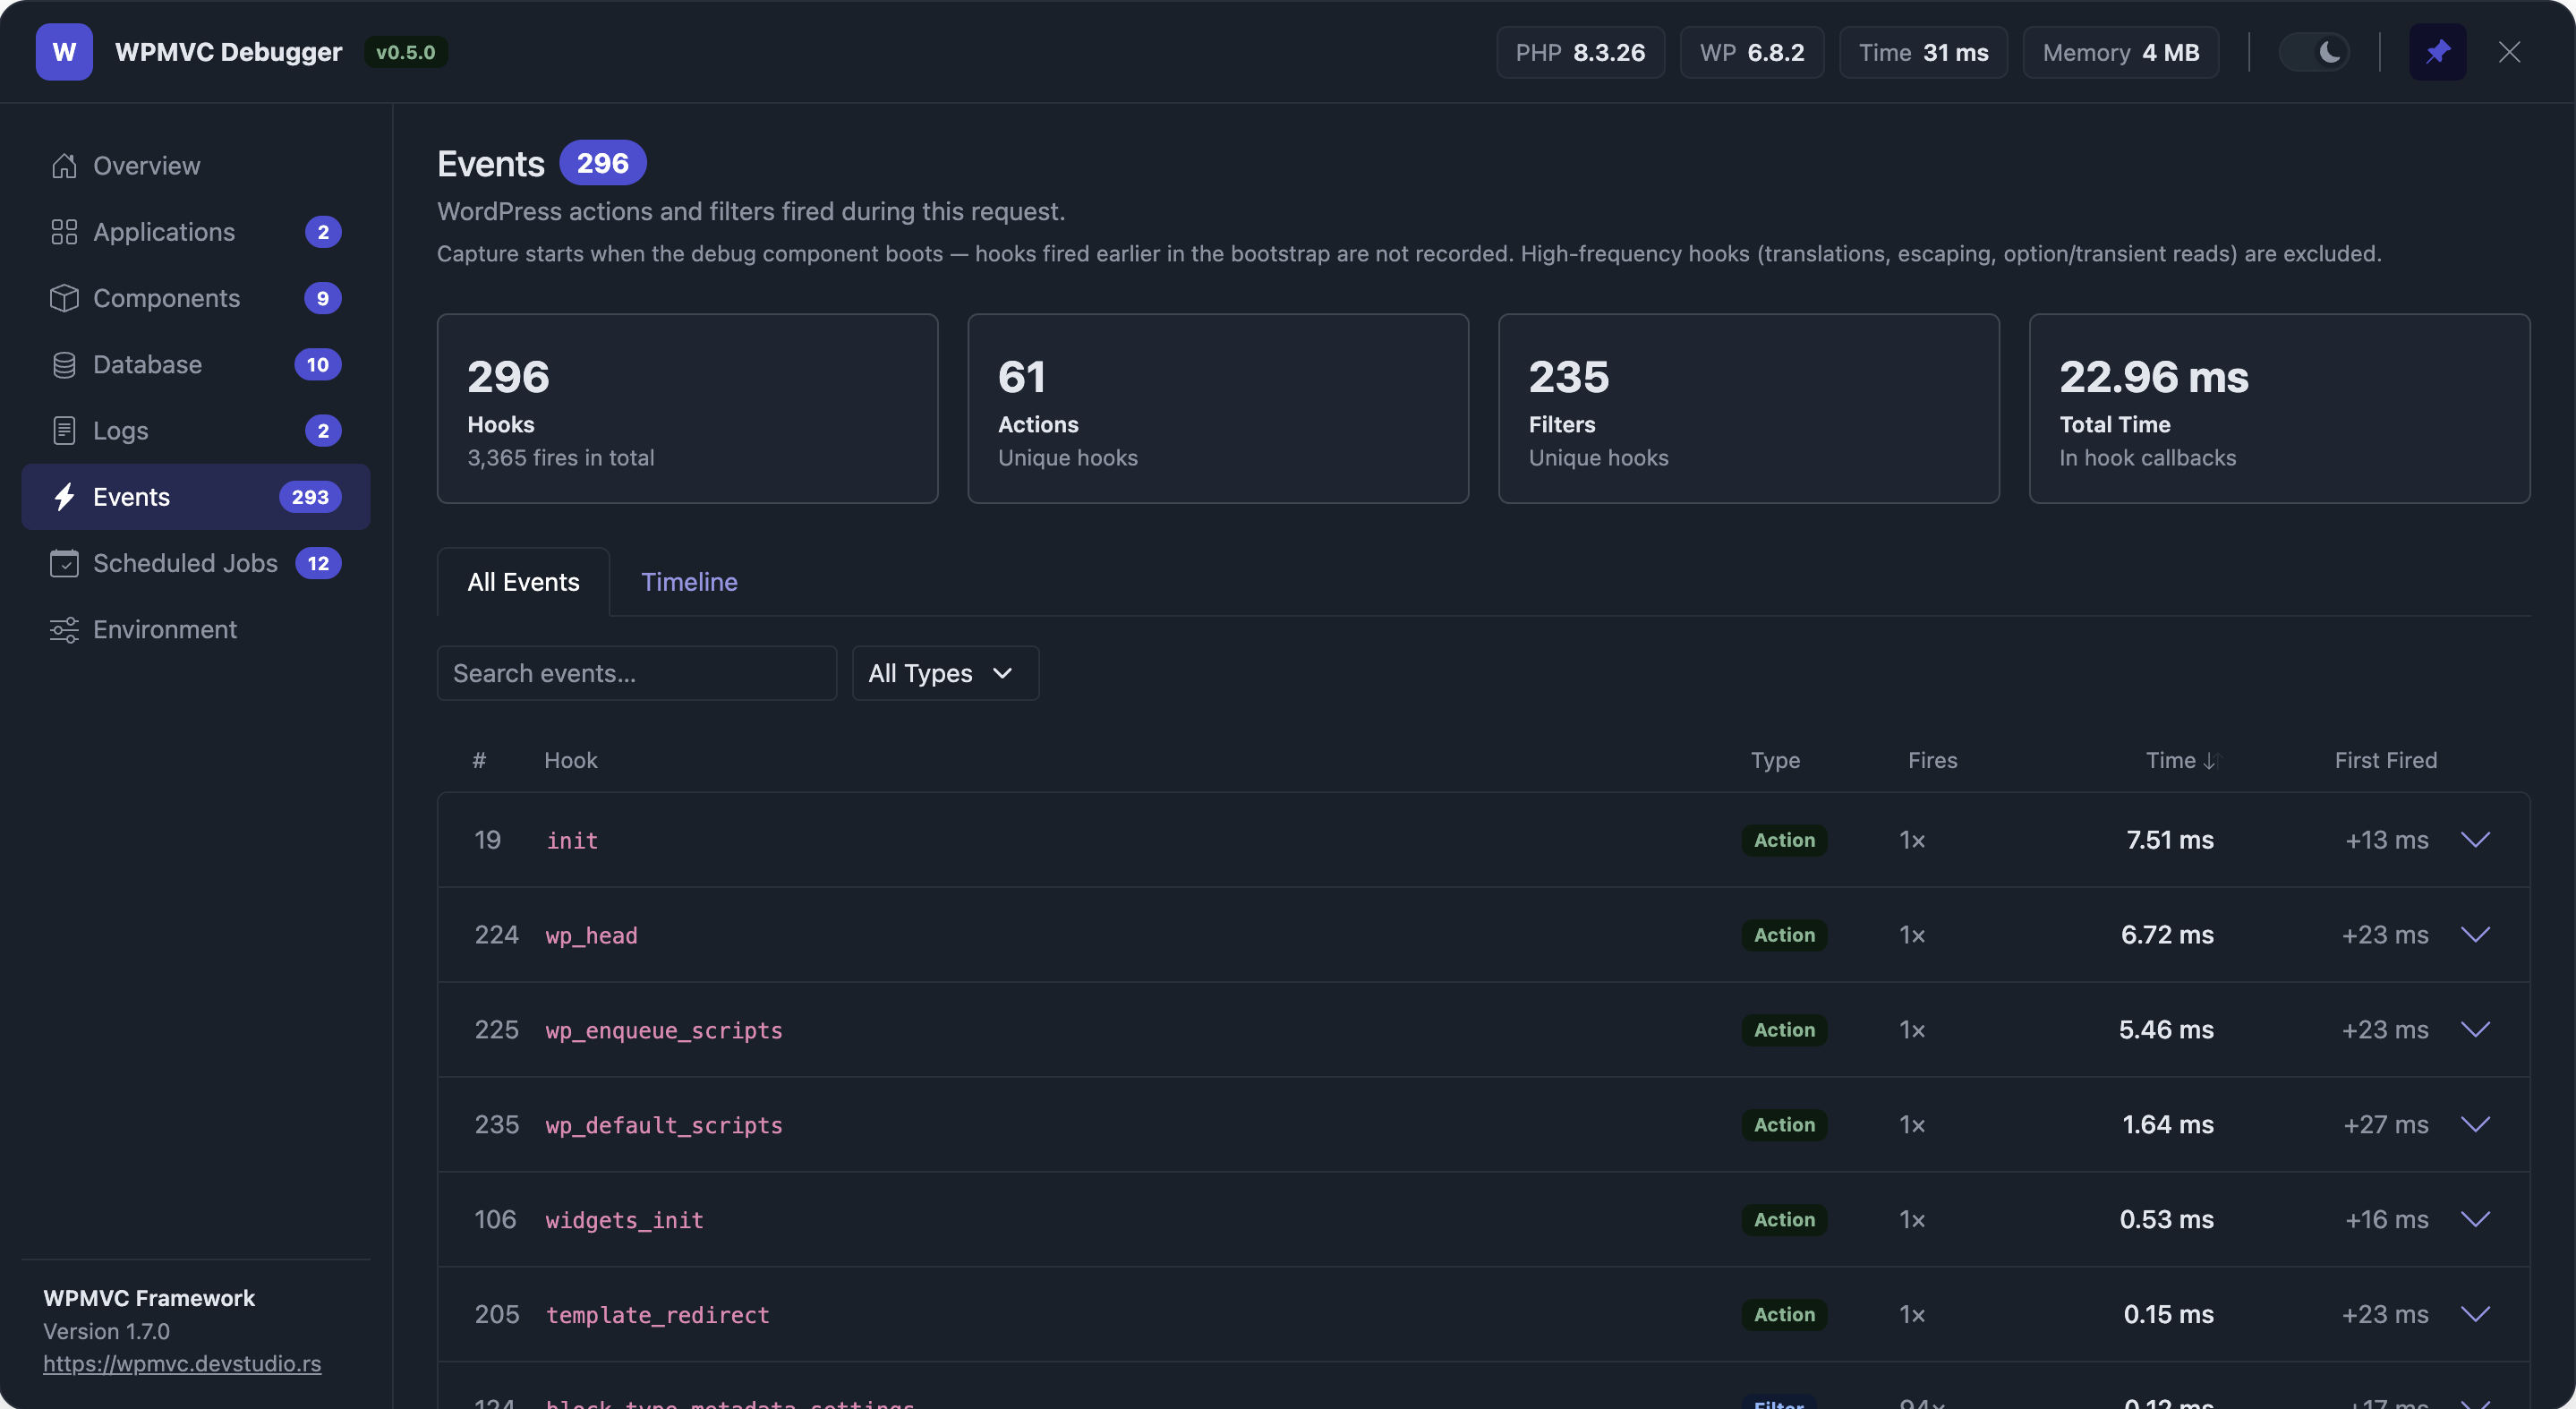
The WordPress actions and filters fired during the request, aggregated per hook: type, fire count, total execution time and when it first fired. The list is searchable, filterable by type and sortable by time (to surface the slowest hooks first). Each row expands to timing details and the callbacks registered on the hook (priority, source, file and line). A Timeline sub-tab charts every hook as a bar — positioned at its first fire within the request, sized by the total time spent in its callbacks.
Capture starts when the component boots, so hooks fired earlier in the bootstrap (mu-plugins and plugins loading) are not recorded. High-frequency noise hooks (translations, escaping, per-option/transient reads) are excluded, and recording is capped at 500 unique hooks per request.
Scheduled Jobs
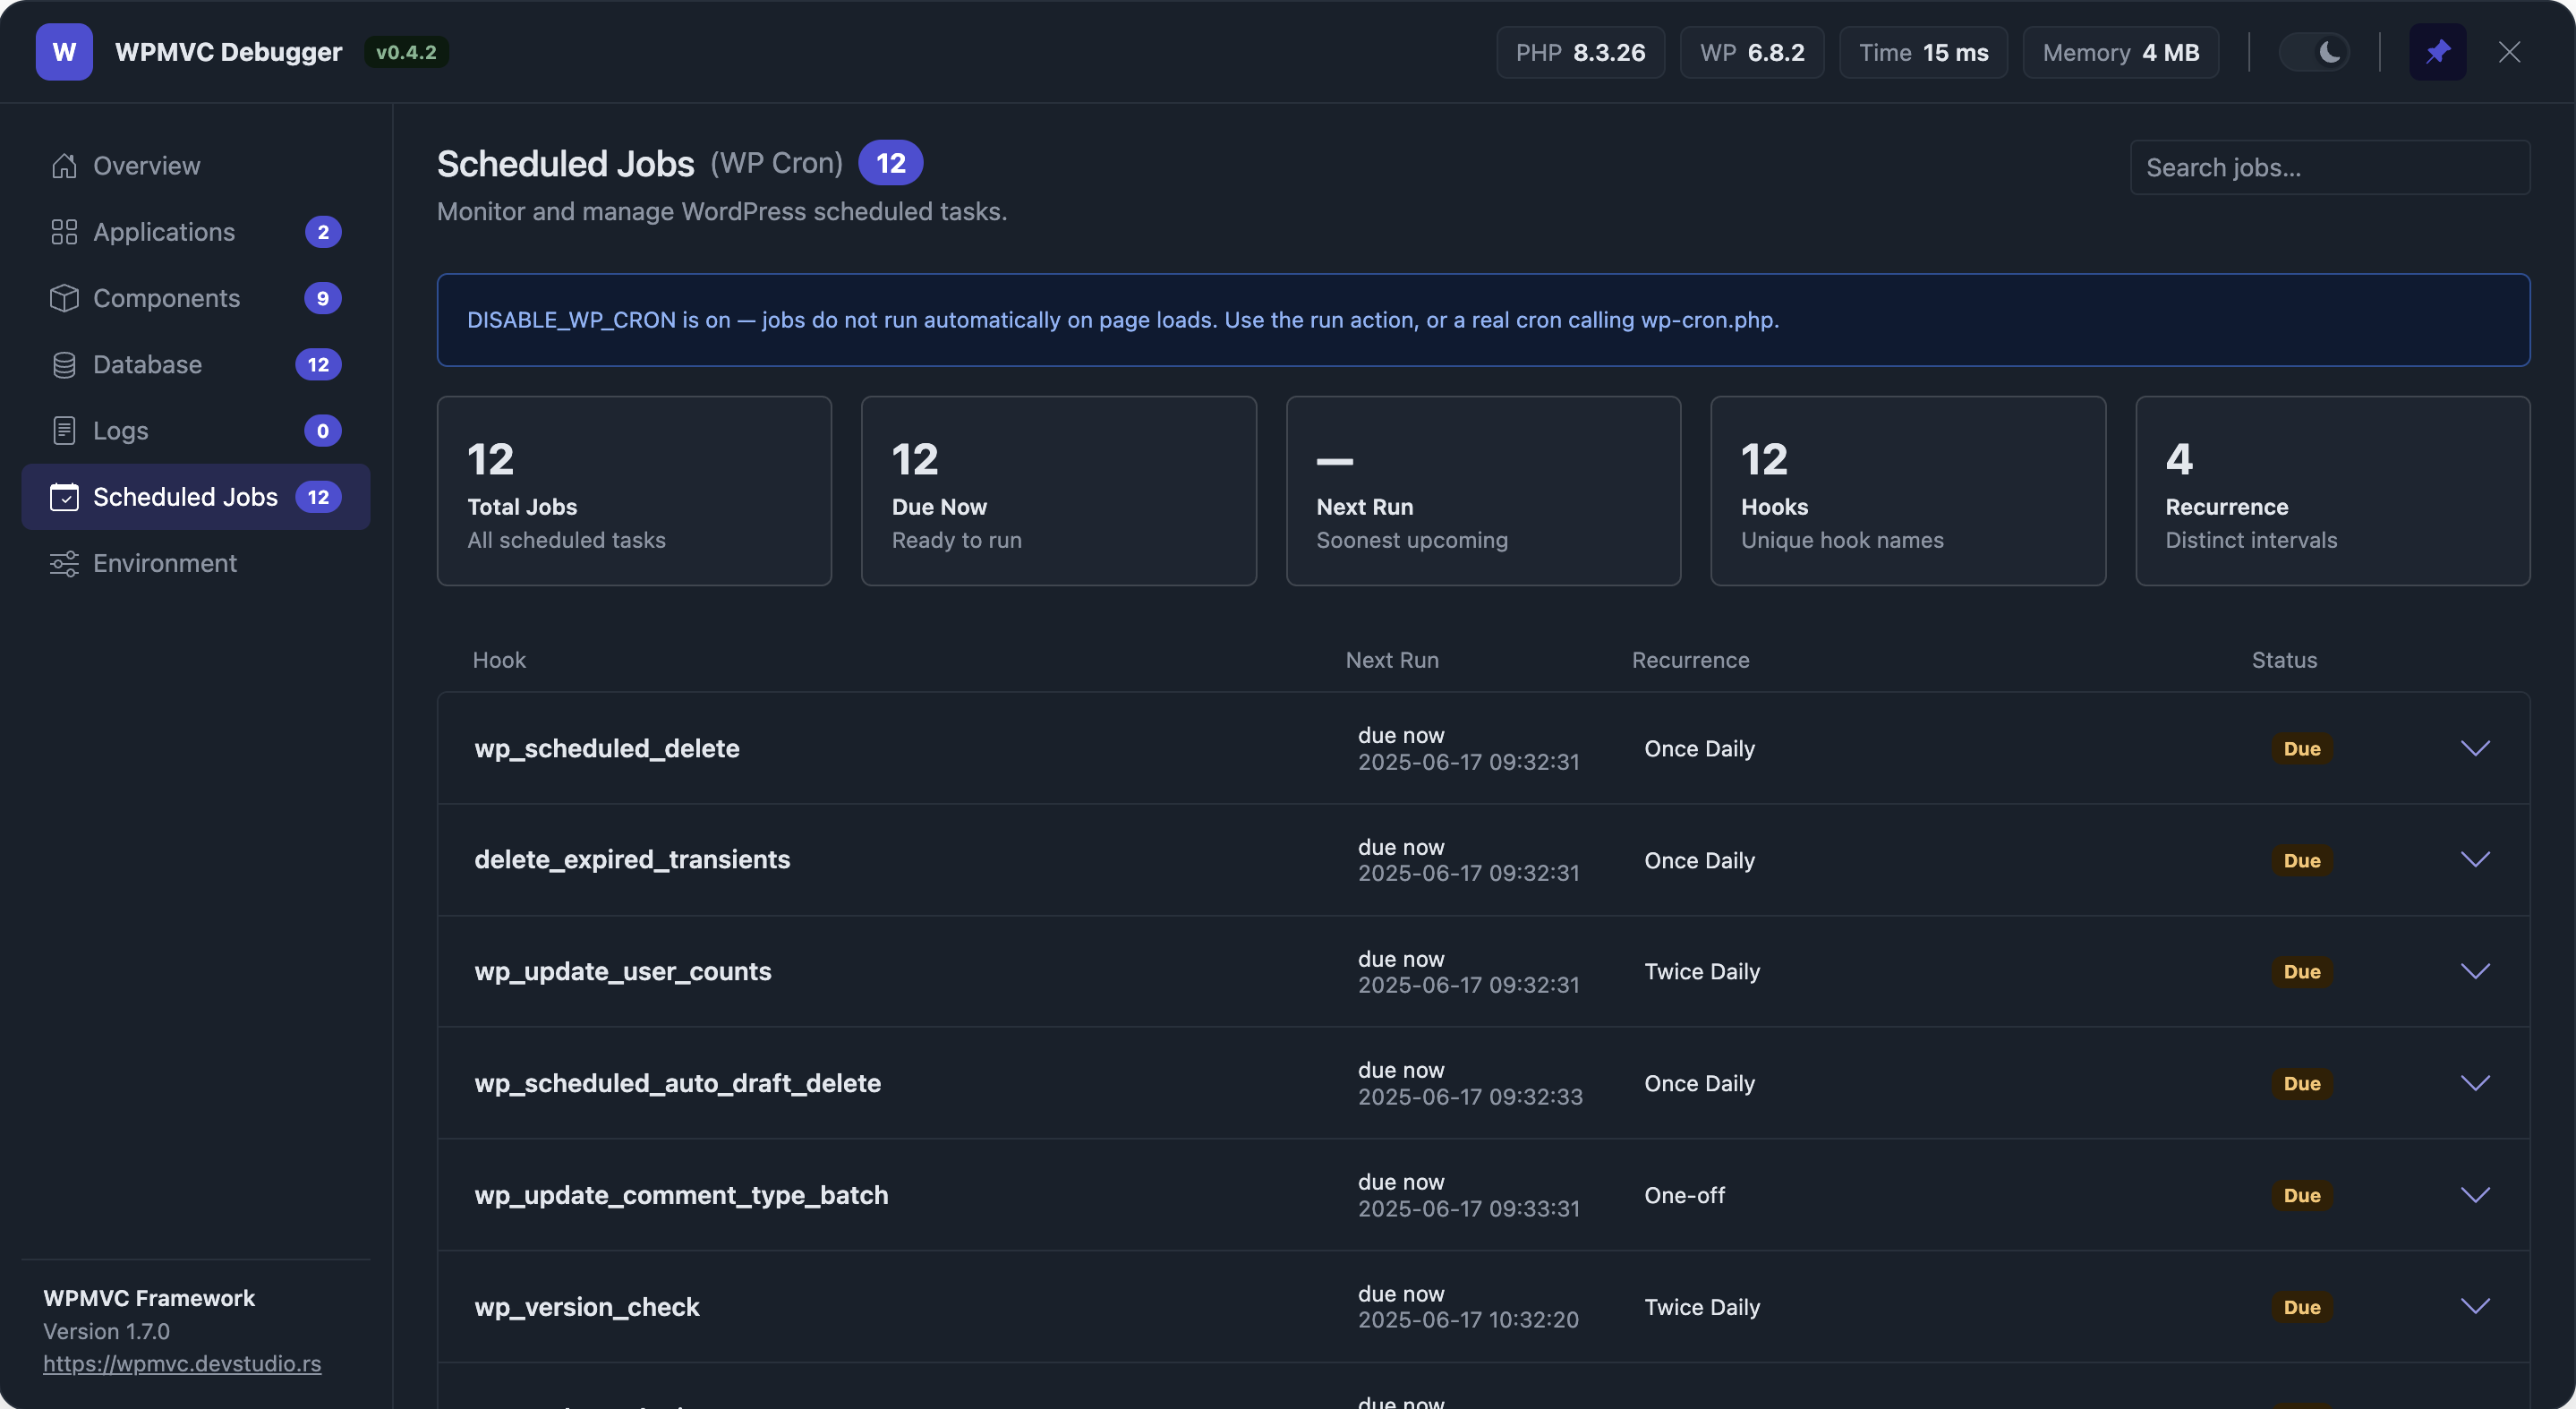
The WP-Cron schedule (_get_cron_array()): every event with its next run, recurrence, arguments and status, plus summary stats. Administrators can expand a job to run it now or delete it.
Cache
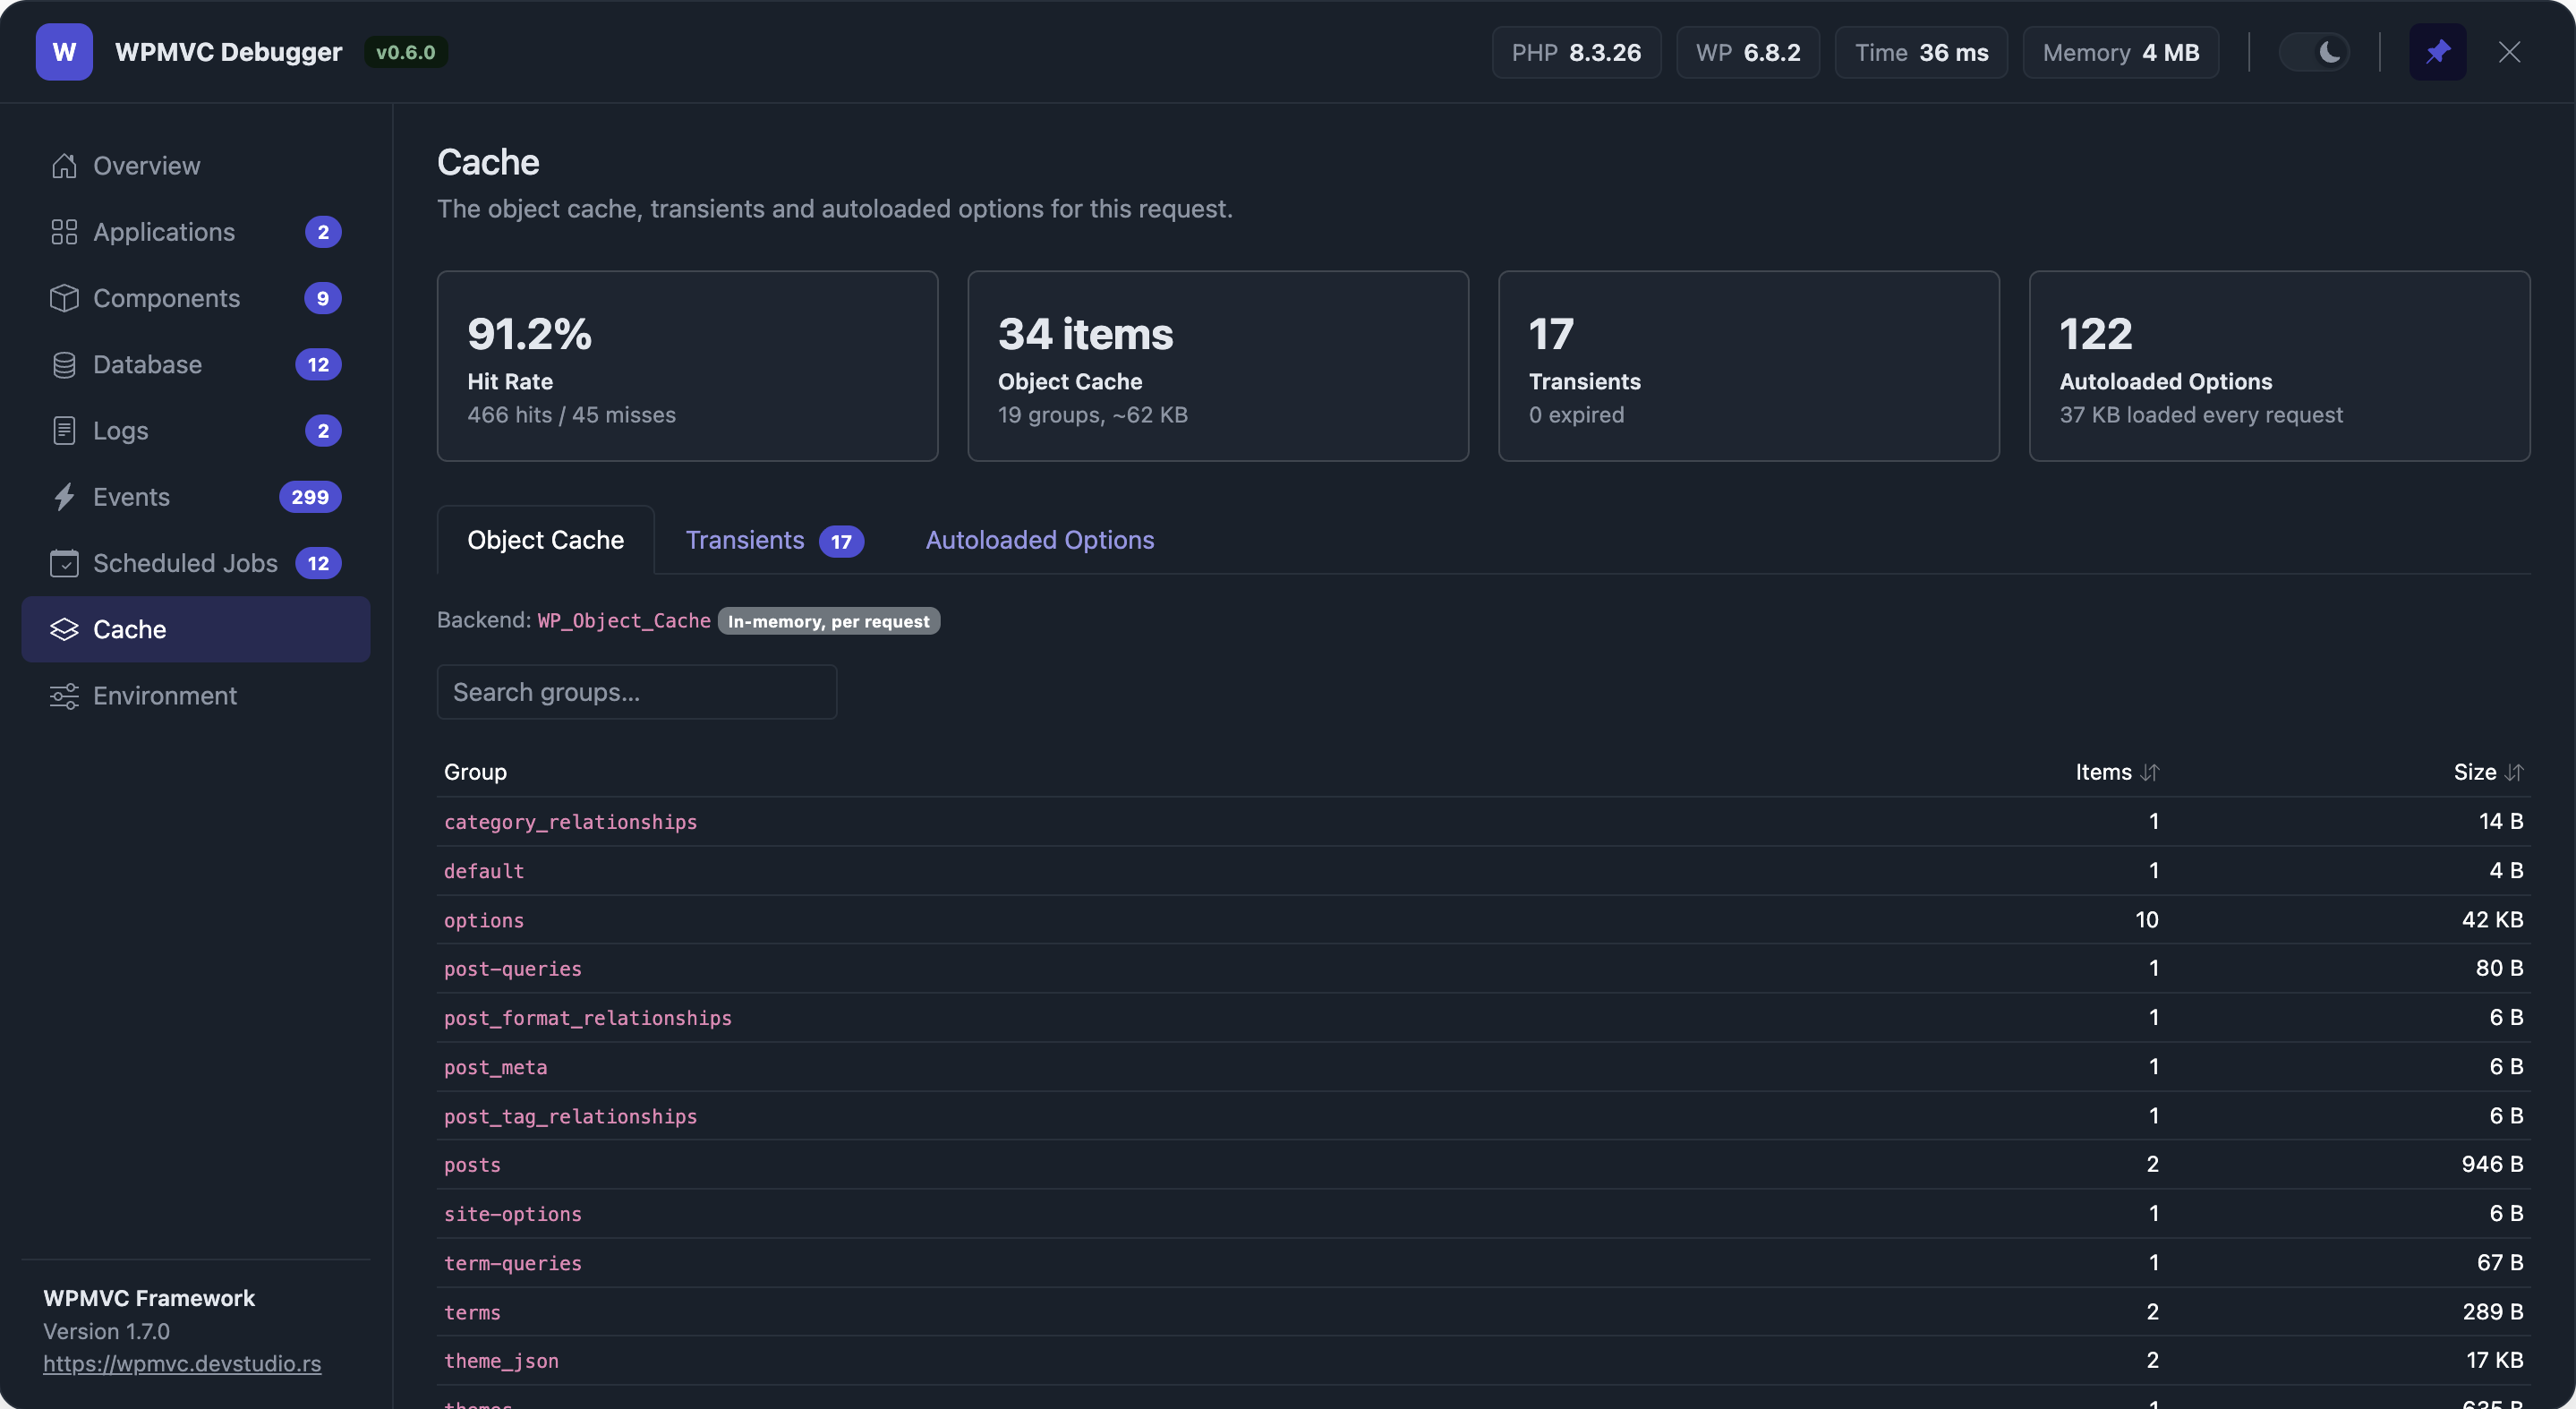
What WordPress's caching layers actually expose, in three sub-tabs: Object Cache — the active backend (core's in-memory cache or a persistent drop-in), this request's hits/misses and hit rate, and the cache contents per group with item counts and approximate sizes; Transients — every transient in the database with its scope, expiry state and size; Autoloaded Options — how many options load on every request, their combined size, and the largest ones. Administrators can flush the object cache (persistent backends only) and delete expired transients.
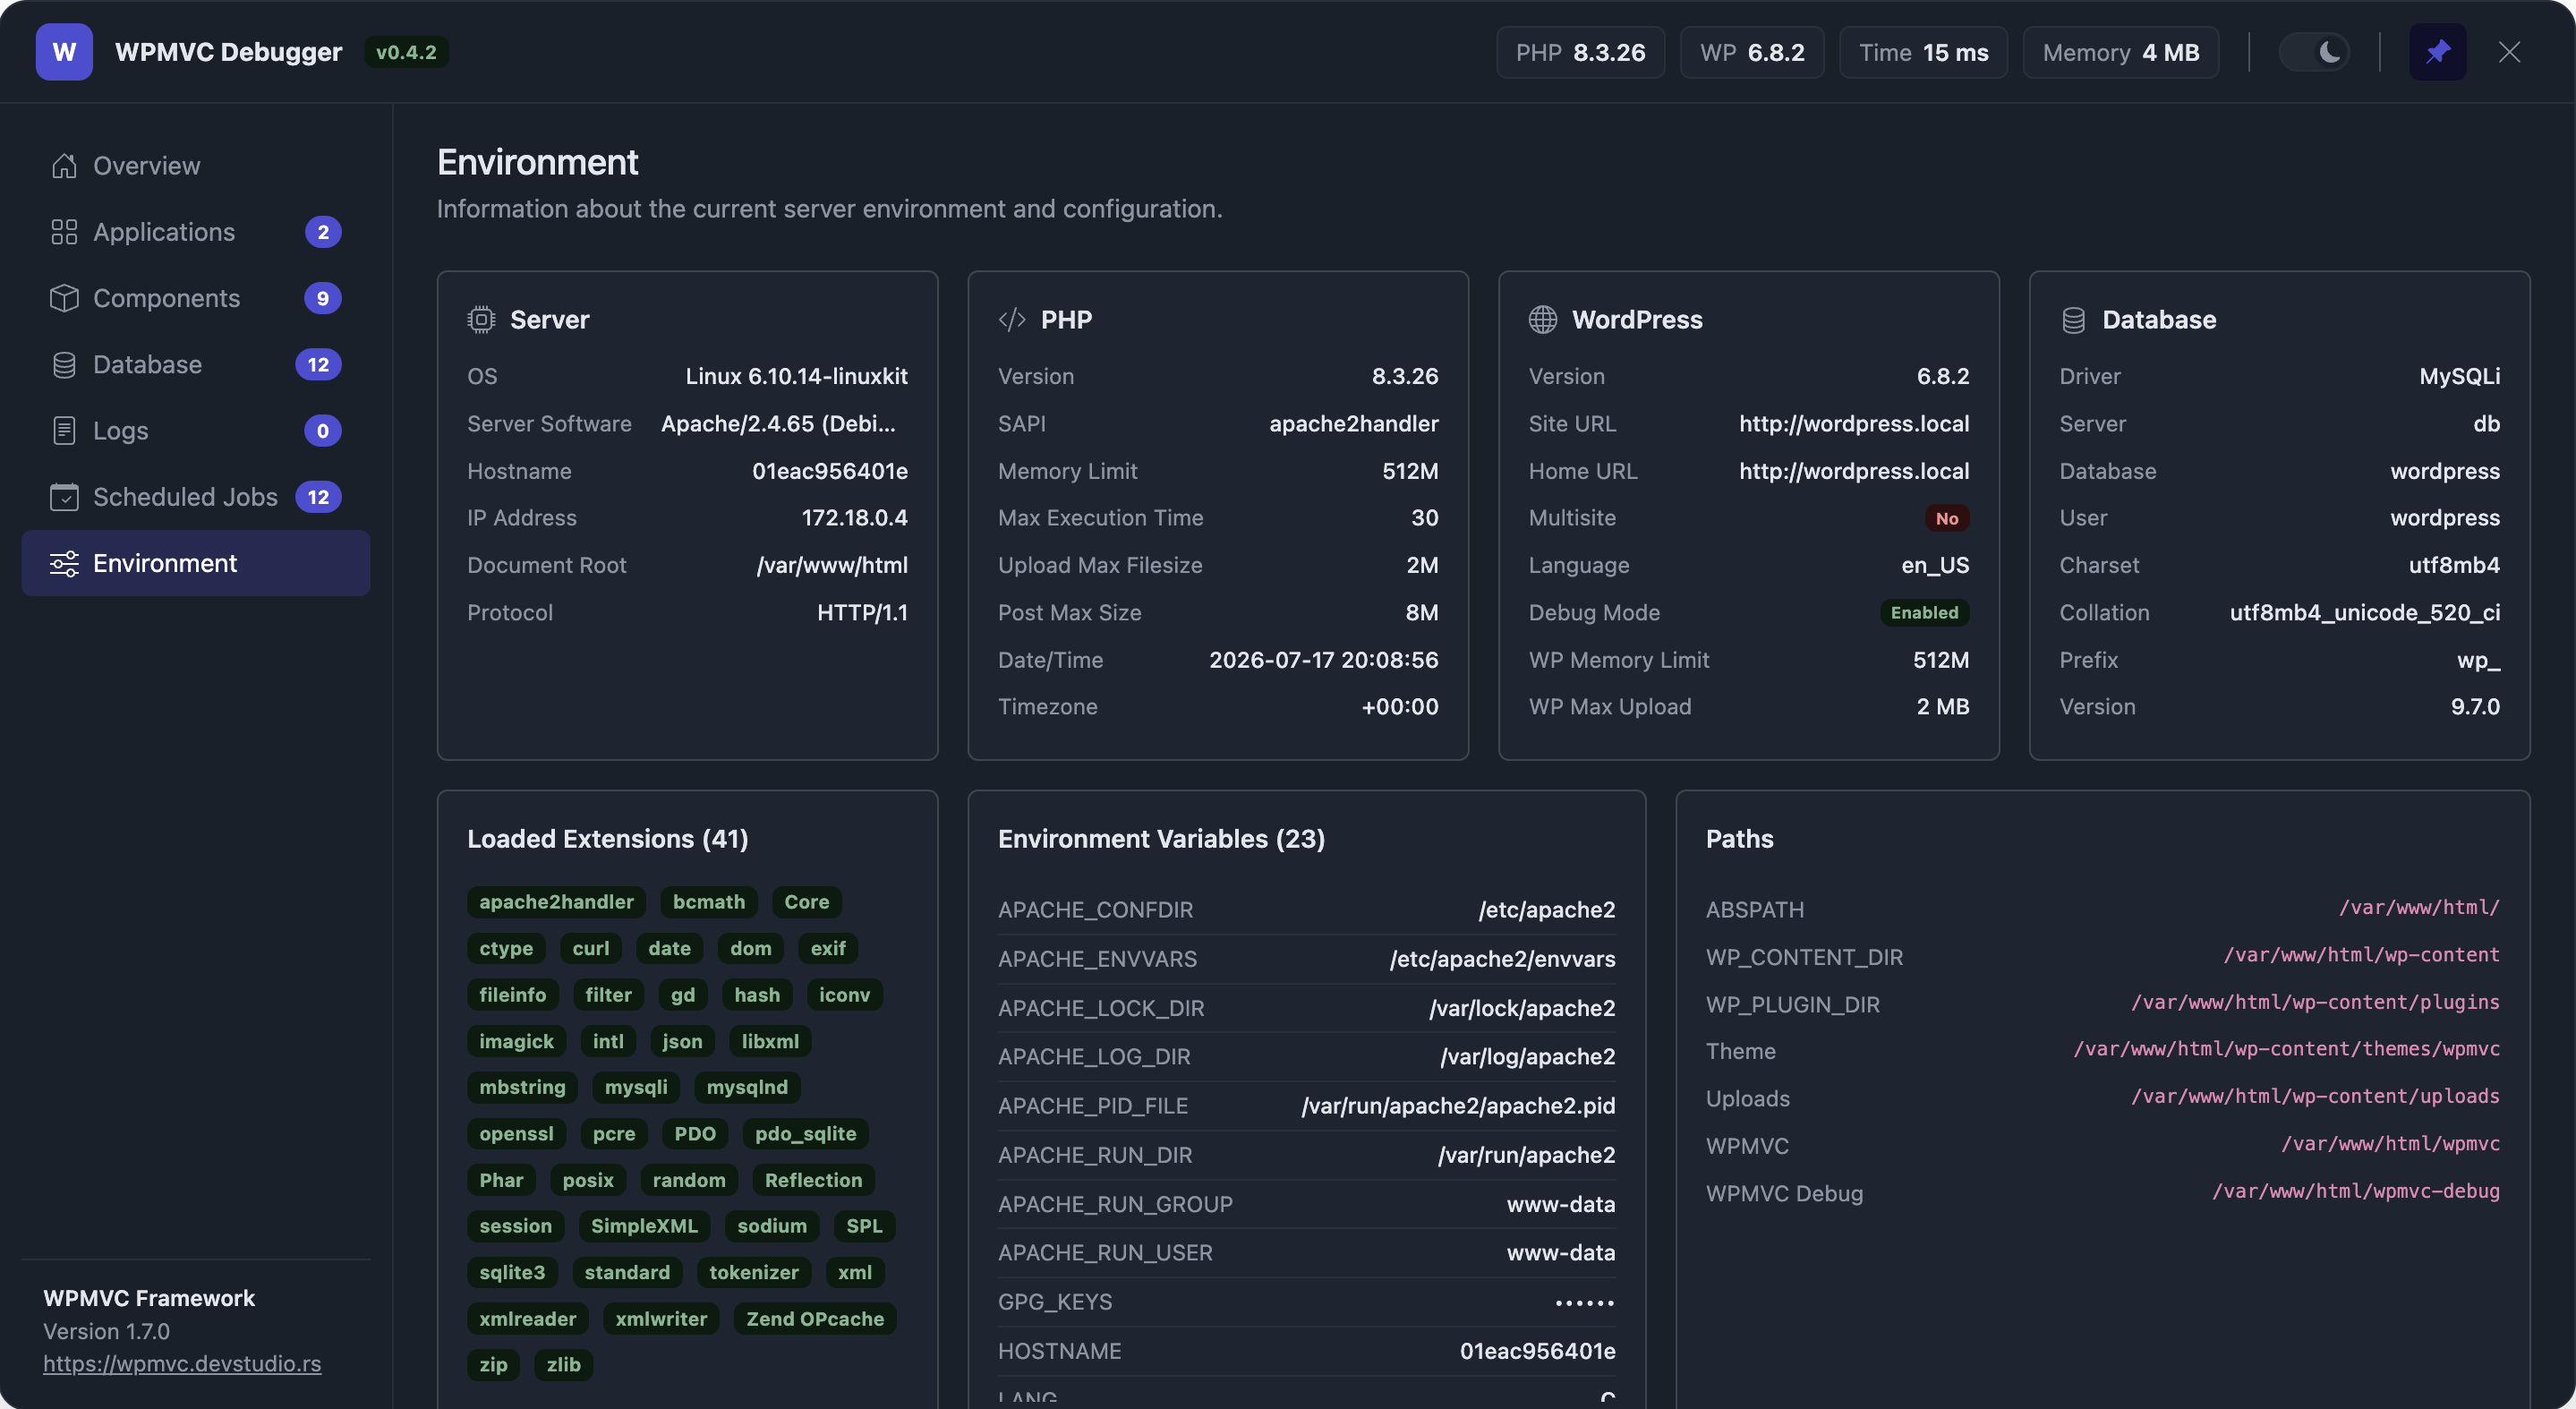
Environment
Server, PHP, WordPress and database configuration, the loaded PHP extensions, environment variables (with secrets masked) and notable filesystem paths.
Extending
Each tab is a small class in the package's src/tabs/ directory, registered in the Debug component's tab list. Because that list is a component attribute, the tab set can be overridden through the component config — the same way any WPMVC component is customized. A dedicated tab API for third-party collectors is on the roadmap.